Information Design - Final Project

Ameera Rihana binti Remy Ansara
Information Design / Bachelor of (hons) in Creative Media
Final Project - Animated Infographics
INSTRUCTIONS
Fig 3.0 Final Project Brief and Instructions (refer slide 32 - 37)
Research the given topic in your group and break down the information into parts
Use relevant visuals to create associations of information to the infographics. Refer to the chart here to decide how to visualize.
Expected outcomes:
An animated infographic informing the audience about a given topic (min 1.5)
- narrative and visualization to educate the viewers about the issue.
Use relevant visuals to create associations of information to the infographics. Refer to the chart here to decide how to visualize.
Expected outcomes:
An animated infographic informing the audience about a given topic (min 1.5)
- max 3 min video)
Must include some form of data/statistics.
Must use the questioning technique and provide answers.
FINAL PROJECT
Final Project: Animated Infographics
Requirement: An animated infographic informing the audience about a given topic (min 1.5)
- max 3 min video)
Must include some form of data/statistics.
Must use the questioning technique and provide answers.
__
Topic: The Journey of a Product From Factory to Consumer
Fig 3.1 Research Document - Week 1
Fig 3.2 Miro Board - Week 1

Fig 3.3 Mood Board Style animation - Week 2
To kickstart with our storyboard, our leader sketched simple ideas in order to visualize our animation style based on the information collected.
Fig 3.4 Storyboard Initial Sketches - Week 3

Fig 3.5 Roles Distribution - Week 3
Fig 3.7 Animatic - Week 6
d) Content Creation

Fig 3.8 Background Illustrations - Week 6

Fig 3.9 Character Illustrations - Week 6

Fig 3.11 Final Animation Outcome (Muted) - Week 7
2) https://drive.google.com/drive/folders/1cKyaE47EpSDarwyARxZDO0iHqcT5sf5x?usp=drive_link (Voice Over)

Fig 3.12 Voice Recording - Week 8

Fig 3.13 Sound Effects - Week 8
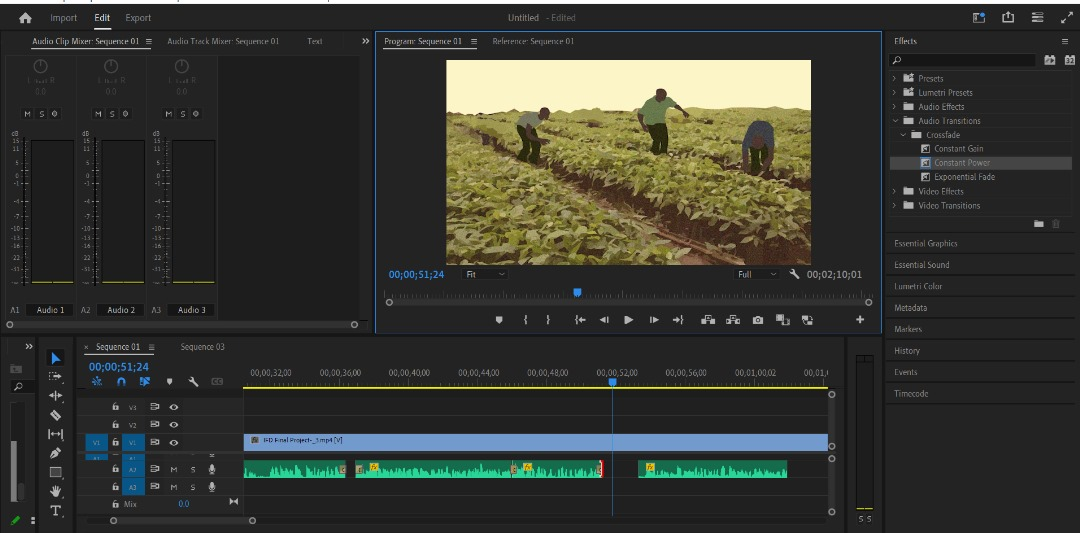
Fig 3.14 Sound & Video Editing - Week 8

Fig 3.15 Graphic Title - Week 8
Week 6:
We are tasked to make a research based on the given topic and break down the information provided into parts (narrative and visualization) to create an animated infographic to educate the viewers about the issue.
a) Data Gathering & Research
Firstly, we took our time to make a research about the process of chocolates along with the hidden issues that people are unaware of related to the production.
Fig 3.1 Research Document - Week 1
We also took the advantage of using Miro Board to save the links and additional information regarding to the production. Additionally, we created a mood board in order to find our suitable style animation. We opted to use a different approach by using whiteboard style animation with partial mixed media / collage. However, we settled for digital animation due to time constraint.
Fig 3.2 Miro Board - Week 1
Fig 3.3 Mood Board Style animation - Week 2
b) Storyboard / Distribution
After some discussion, we've decided on the concept of a one-take linear transition animation. This animation style features transitions that flow horizontally from start to finish, offering viewers a clear and cohesive depiction of the chocolate manufacturing process.
Fig 3.4 Storyboard Initial Sketches - Week 3
For the process of the video production, we distributed among ourselves with different tasks into several parts to become more efficient.
Fig 3.5 Roles Distribution - Week 3
c) Visualization / Animatic & Script Writing
As Mr. Shamsul instructed us to create an animatic using our storyboard, we started to enhance our storyboard by resketching and retracing into a digital form.
Below are the scenes we took part:
- Scene 1-3 by Leen
- Scene 4-6 by Johanna
- Scene 7-9 by Ameera
- Visual Reference collected by Jia Ern
- Script by Alefiya
Fig 3.5 Storyboard (Digital Sketches) - Week 5
Fig 3.6 Script Writing - Week 5
Once we have set up our plan, we proceeded by doing a narration by reading out the script that has written by Alefiya. We then compiled the recordings and the digital sketches into one animatic video using Adobe Premiere Pro.
Fig 3.7 Animatic - Week 6
d) Content Creation
After we were given a thumbs up, we proceeded on the illustrations form some visual elements. We divided the illustrations into different parts such as backgrounds, characters and references.
Google Drive Link:
Fig 3.8 Background Illustrations - Week 6
Fig 3.9 Character Illustrations - Week 6
e) Animation Process on Adobe After Effects
Two of my group members took fully in charged of the animation process in Adobe Effects. They both divided their part by taking half of the scene (50/50).To make the characters movable, our animator used a puppet pin tool to point out the joints on their body and slightly adjusted the position of each to make the characters looked alive and appeared to have limbs.
Fig 3.10 Animation Process - Week 7
Fig 3.11 Final Animation Outcome (Muted) - Week 7
f) Sound / Voice Over Narration
For the narration itself, we decided to retake the voice over due to the bad quality of the audio. Additionally, we compiled the sound effects and music that we used in the video.
Google Drive Link:
1) https://drive.google.com/drive/folders/1oO__hsOWuOkOq0WVd6G-_74bB2odLMNA?usp=drive_link (Sound effects)
2) https://drive.google.com/drive/folders/1cKyaE47EpSDarwyARxZDO0iHqcT5sf5x?usp=drive_link (Voice Over)
Fig 3.12 Voice Recording - Week 8
Fig 3.13 Sound Effects - Week 8
After we have gathered our desired sound production, we began the next phase of video editing in Premier Pro. We aligned the sound effects and the voice over accordingly to the matching pace of the animation. We adjusted certain parts of the volume by adding transitions and audio gain so that the sounds did not overlapped or overpowered with one another. We also created a title for the video.
Fig 3.14 Sound & Video Editing - Week 8
Fig 3.15 Graphic Title - Week 8
g) Final Outcome of Animated Infographics
Final Topic: Unwrapping Cadbury's Dark Secret
Google Drive LInk: https://drive.google.com/drive/folders/1gm9vriznUx5gfQ08Cok7kL-ICxhXYmrk?usp=drive_link
FEEDBACK
Week 5:
Specific Feedback: Mr. Shamsul suggested we should include information in data form such as charts of the population of chocolate consumers around the world/ income of chocolate factories and more.
Week 6:
Specific Feedback: Mr. Shamsul suggested that the volume of the background music/ sound effects should not disturb the main narration; try to lower the volume so that it is not distracting. Add more scenes that match the narration along with the animation.
REFLECTION
Experience: To wrap things up, the experience of creating an infographic is very delightful. Though we encountered certain challenges in group cohesion, the process was ultimately fulfilling. Our collective efforts not only broadened our comprehension of the topic but also honed our collaborative and creative abilities, equipping us for future endeavors in academic and professional realms.
Observation: Observing how information flows from one frame to another in the animatic can reveal insights into the narrative structure. This includes observing how transitions between scenes or elements contribute to the overall storytelling.
Observation: Observing how information flows from one frame to another in the animatic can reveal insights into the narrative structure. This includes observing how transitions between scenes or elements contribute to the overall storytelling.
Findings: Observing the flow and coherence of the storyboard can provide insights into its effectiveness in conveying the intended message. This includes identifying whether the storyboard effectively communicates key information and concepts in a clear and engaging manner.
Comments
Post a Comment